Counter-Argument: In Defence of Australia’s Agent-Assisted Property Market
Date: 2026-05-11
Topic: Pushback on the “Private Property Sales” thesis — why Australia’s agent-dominated market is rational, efficient, and better for consumers than the alternatives
Responds to: au-private-property-sale-20260508.md
Sources: NAR 2025 Profile of Home Buyers and Sellers, Kellogg School of Management (Hendel, Nevo, Ortalo-Magné), InfoTrack 2025 State of Real Estate Report, Clever Real Estate, ACCC, REA Group filings, Global Property Guide, US DOJ, World Habitat, ScienceDirect
Core Thesis
The original report frames Australia’s 1-2% FSBO rate as evidence of a broken, structurally monopolised market that needs disruption. This counter-argument presents the opposite case:
- Australia’s agent commission structure is among the cheapest in the world — the comparison to the US is backwards
- FSBO sellers consistently achieve lower prices — the commission more than pays for itself
- FSBO is declining globally, not just in Australia — the trend isn’t structural capture, it’s rational consumer choice
- The “Airbnb for real estate” analogy is aspirational, not instructive — Airbnb’s disruption has caused documented harm
- Consumer satisfaction with the agent-assisted model is high and rising — 83% of Australians rate their experience positively
- REA Group’s audience delivers genuine value — dismissing it as “monopoly rent” ignores what it provides
- The US system the original report holds up as superior is actually worse for consumers
1. Australia’s Commission Rates Are Among the Lowest in the World
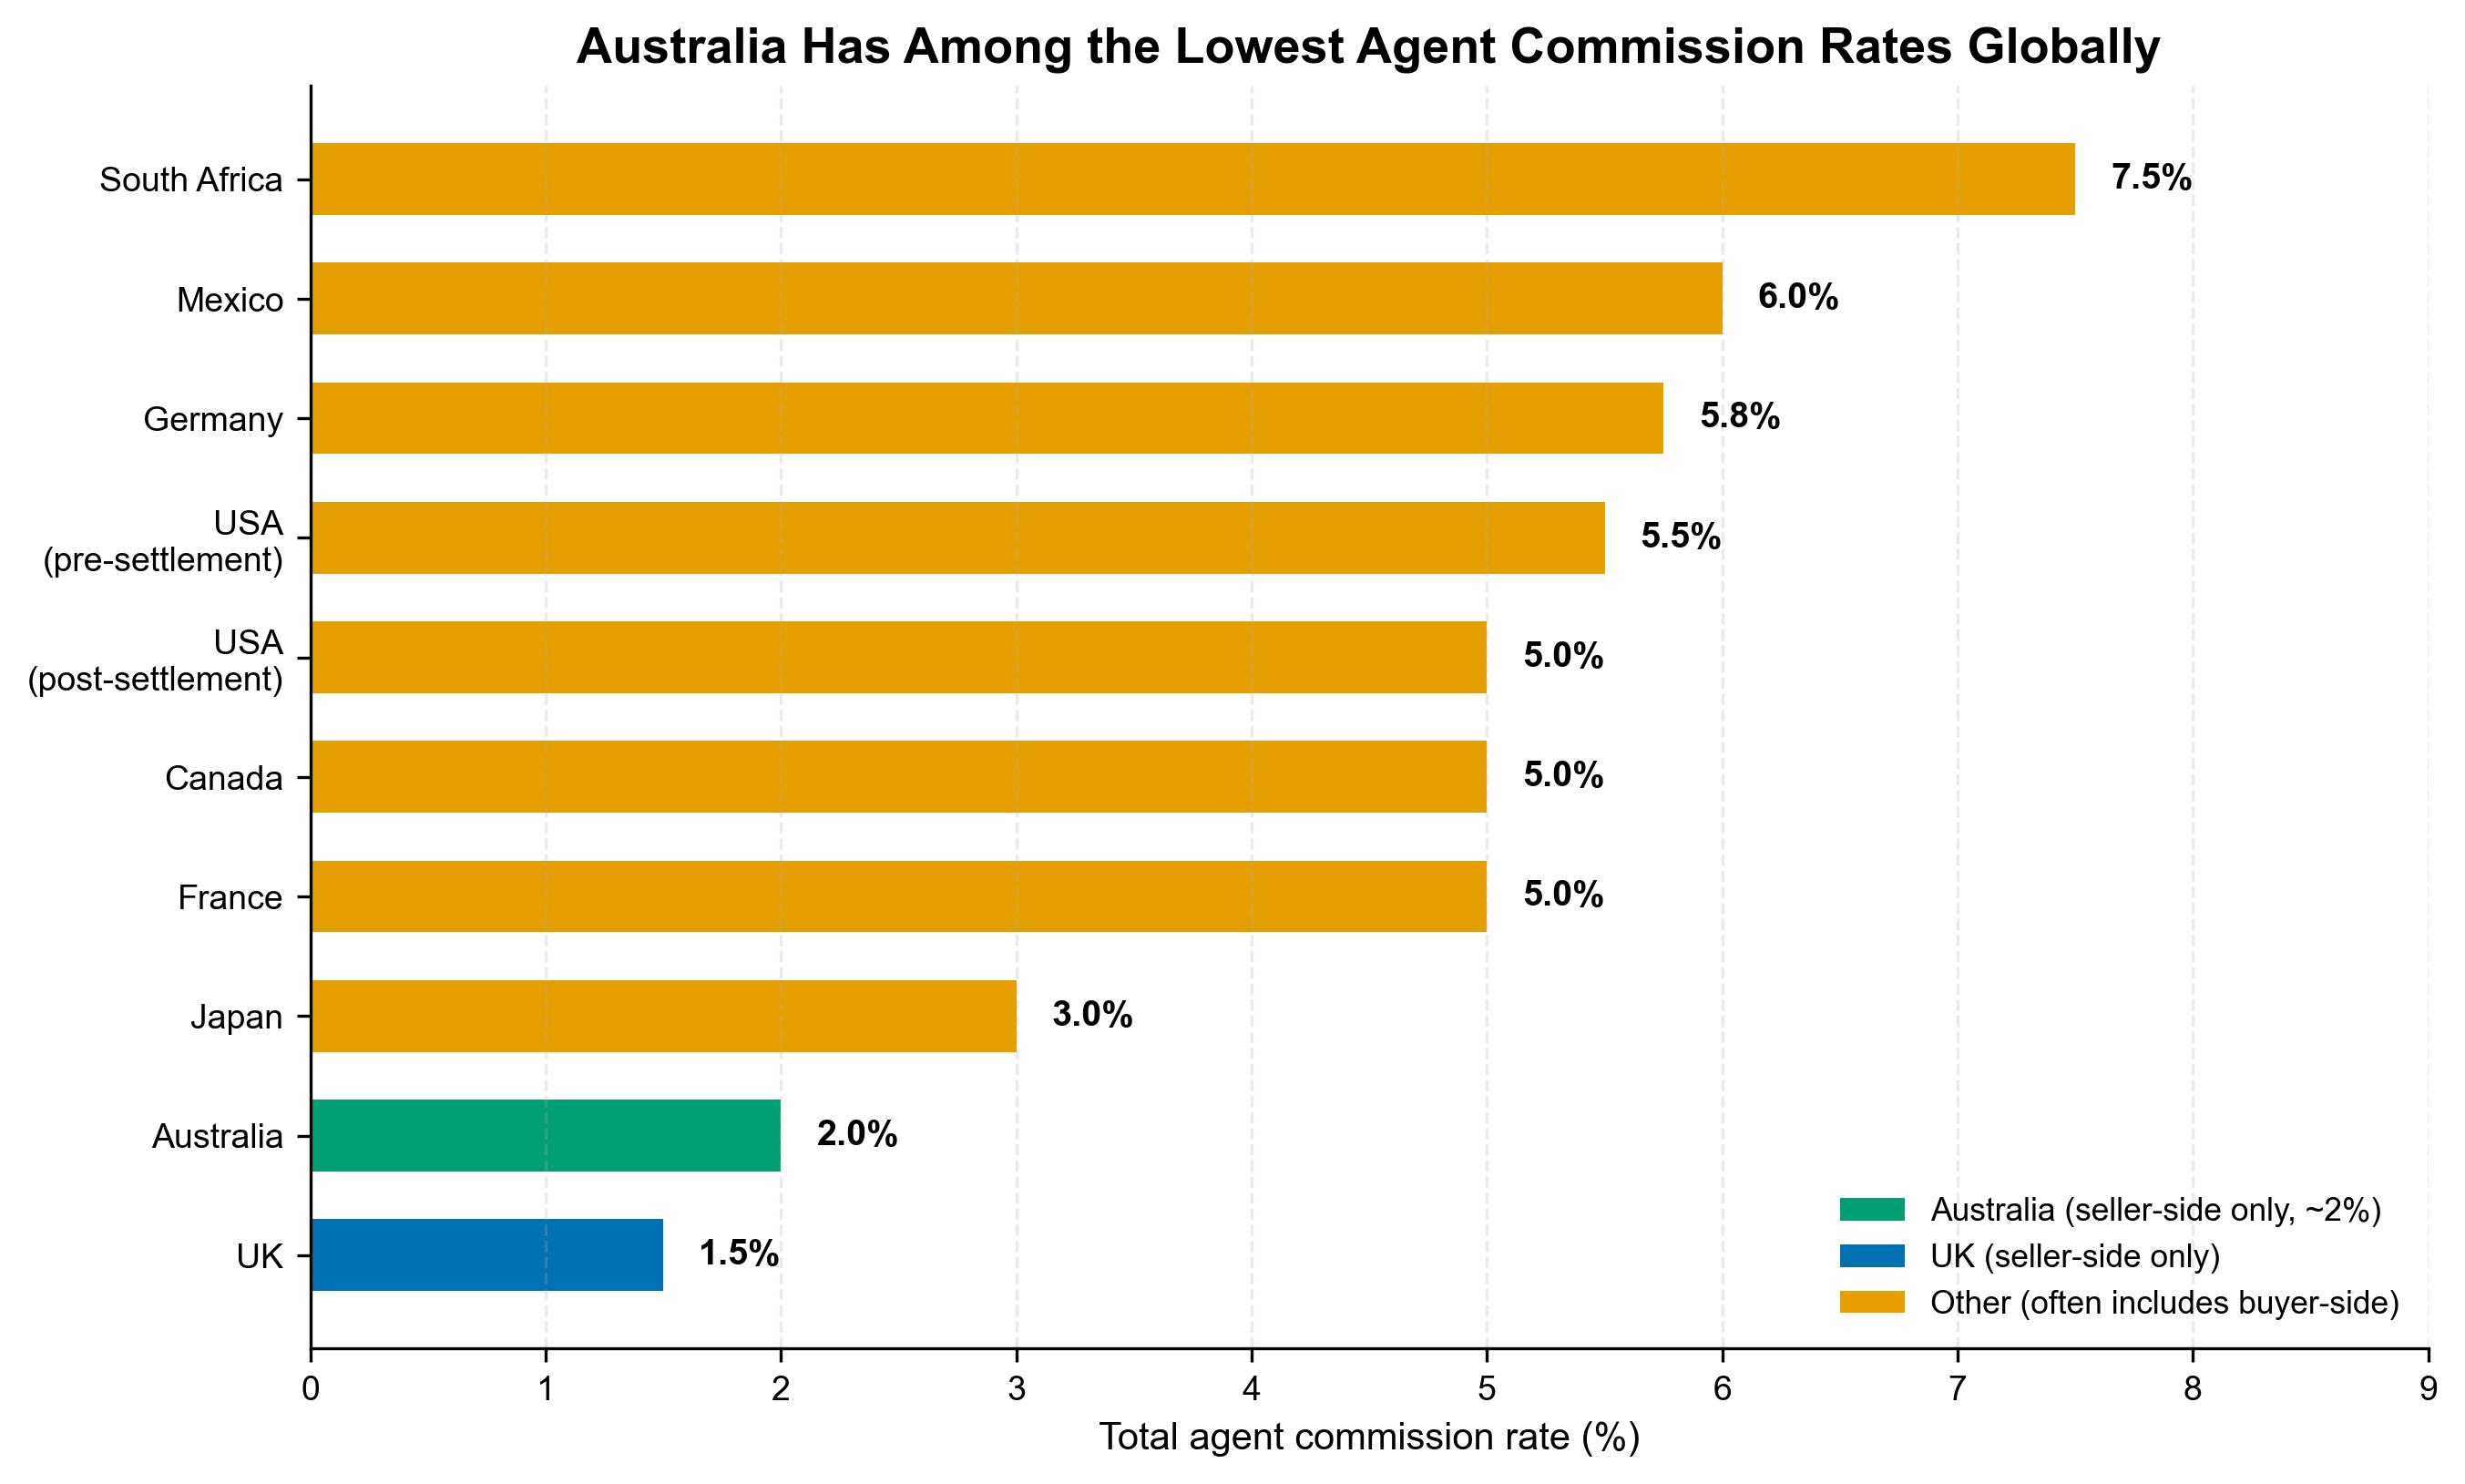
The original report highlights Australia’s ~2% commission rate but frames it as extractive. In global context, it’s the opposite — Australia is one of the cheapest markets in the world for sellers.
| Country | Typical total commission | Who pays | Marketing costs |
|---|---|---|---|
| Australia | 1.5-3% | Seller only | Seller pays separately |
| United Kingdom | 1-3% | Seller only | Seller pays separately |
| United States (pre-NAR settlement) | 5-6% | Seller pays both sides | Agent absorbs |
| United States (post-NAR settlement) | ~5% (still) | Seller often still pays both | Agent absorbs |
| Canada | 5% | Seller pays both sides | Agent absorbs |
| France | 5-8% | Buyer or split | Included |
| Germany | 5.75% average | Split buyer/seller | Included |
| South Africa | 7.5% | Seller | Included |
| Mexico | 5-6% | Seller | Agent absorbs |
Source: Global Property Guide (globalpropertyguide.com), WSJ International RE Commission Survey (PDF)
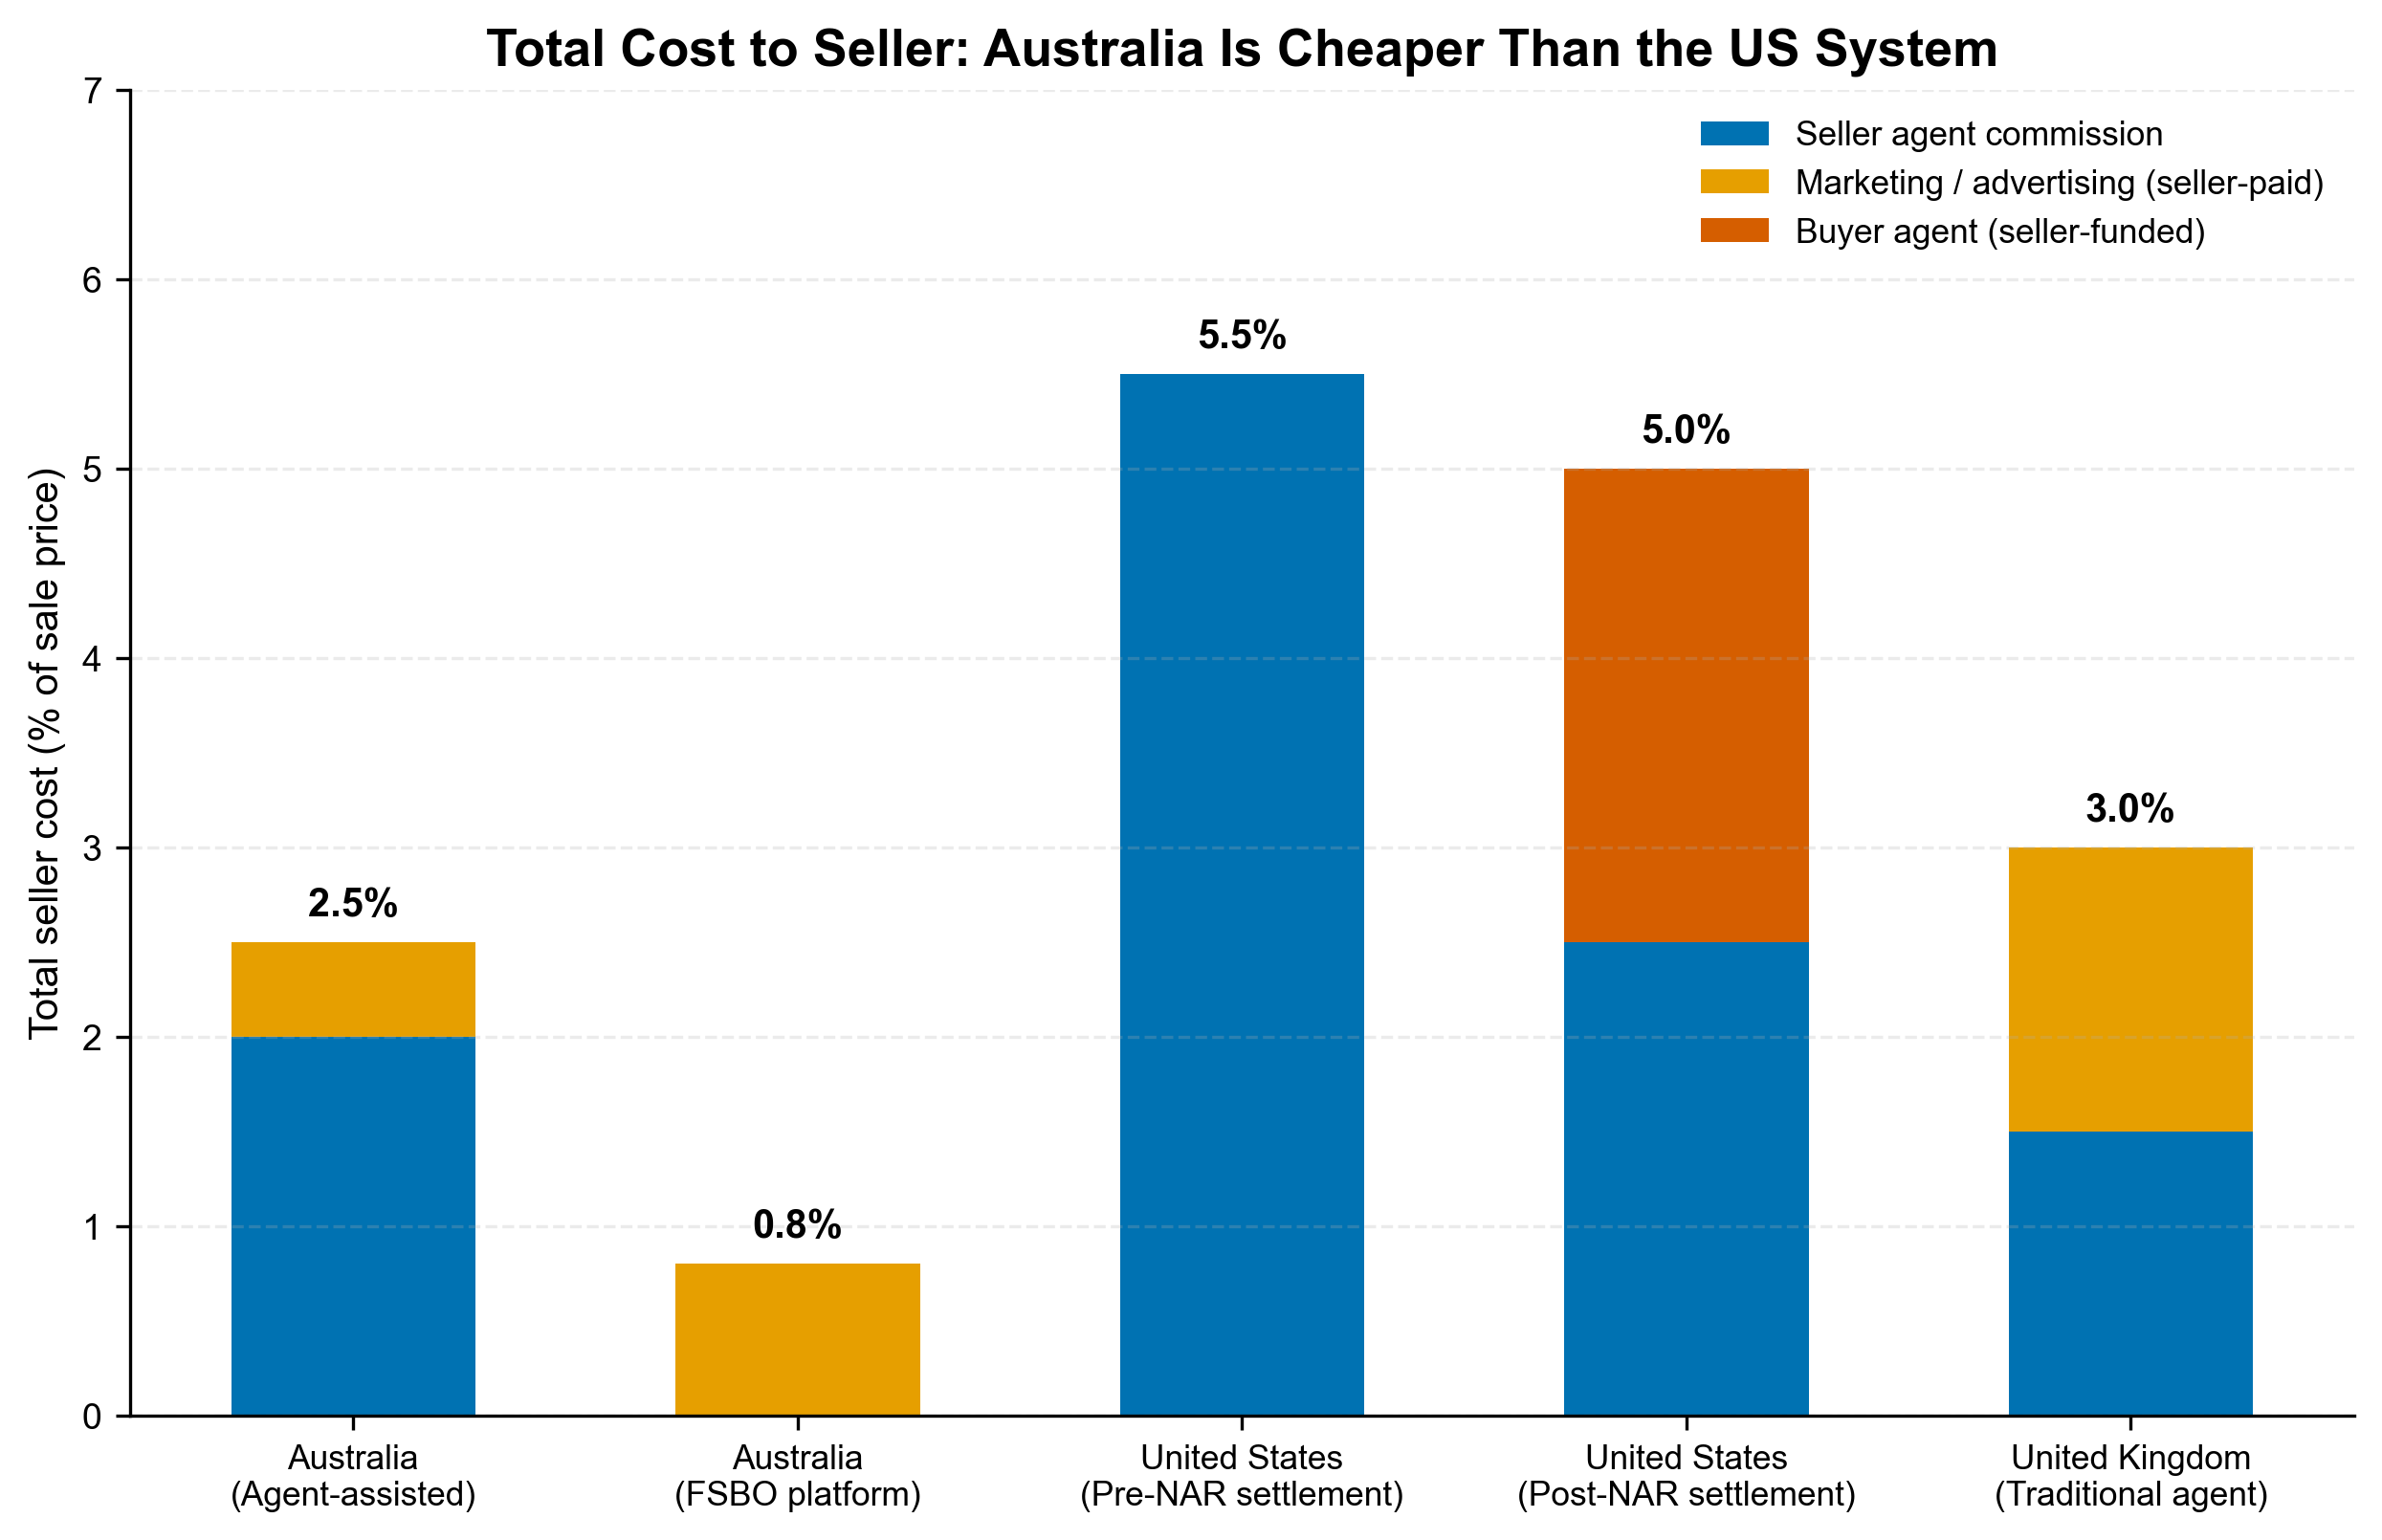
The original report notes Australian sellers pay ~2% commission plus ~$4,000 in advertising — a total of roughly 2.5% on a median-priced home. By contrast, US sellers were paying 5.5% pre-settlement, and post-NAR settlement, 63% of sellers are still covering buyer-agent commissions, meaning the effective rate has barely moved:
“63% of respondents reported home sellers often covering buyer-broker commissions.”
— Real Brokerage post-settlement survey (NAR Settlement Q&A, NEIRELO)
The total cost to an Australian seller (commission + marketing) is roughly half what an American seller pays. Framing the Australian system as exploitative while implicitly holding up the US as a model gets the comparison exactly backwards.
The “Sellers Pay Advertising Separately” Objection
The original report highlights that Australian sellers pay advertising costs directly as if this is unusual or predatory. But in the US model where agents “absorb” marketing costs, those costs are simply embedded in a higher commission rate — the seller still pays, just less transparently. The Australian model is actually more transparent: sellers see exactly what they’re paying for and can control the budget.
As one US real estate analyst noted:
“In Australia, agents are less collaborative, and over 40% of homes are not even sold in the same manner as we do here in the States… the homeowner cuts a check for $10,000, and if the house doesn’t sell, they don’t get that $10,000 back… In the United States, the traditional approach has been different. Agents typically charge a higher percentage, but they also cover the expenses and marketing costs from their own pocket.”
— Darryl Davis, Comparing Commissions (darrylspeaks.com)
Both models have trade-offs. Neither is strictly “better.” But the Australian model, with its lower headline rate and itemised costs, is at worst neutral and arguably more honest.
2. FSBO Sellers Consistently Achieve Lower Sale Prices
The original report treats private sales as a consumer benefit being denied. But the weight of evidence shows FSBO sellers lose money — often more than they save on commission.
The NAR Data (US, but directionally relevant)
The NAR’s 2025 Profile of Home Buyers and Sellers — their largest annual survey — found:
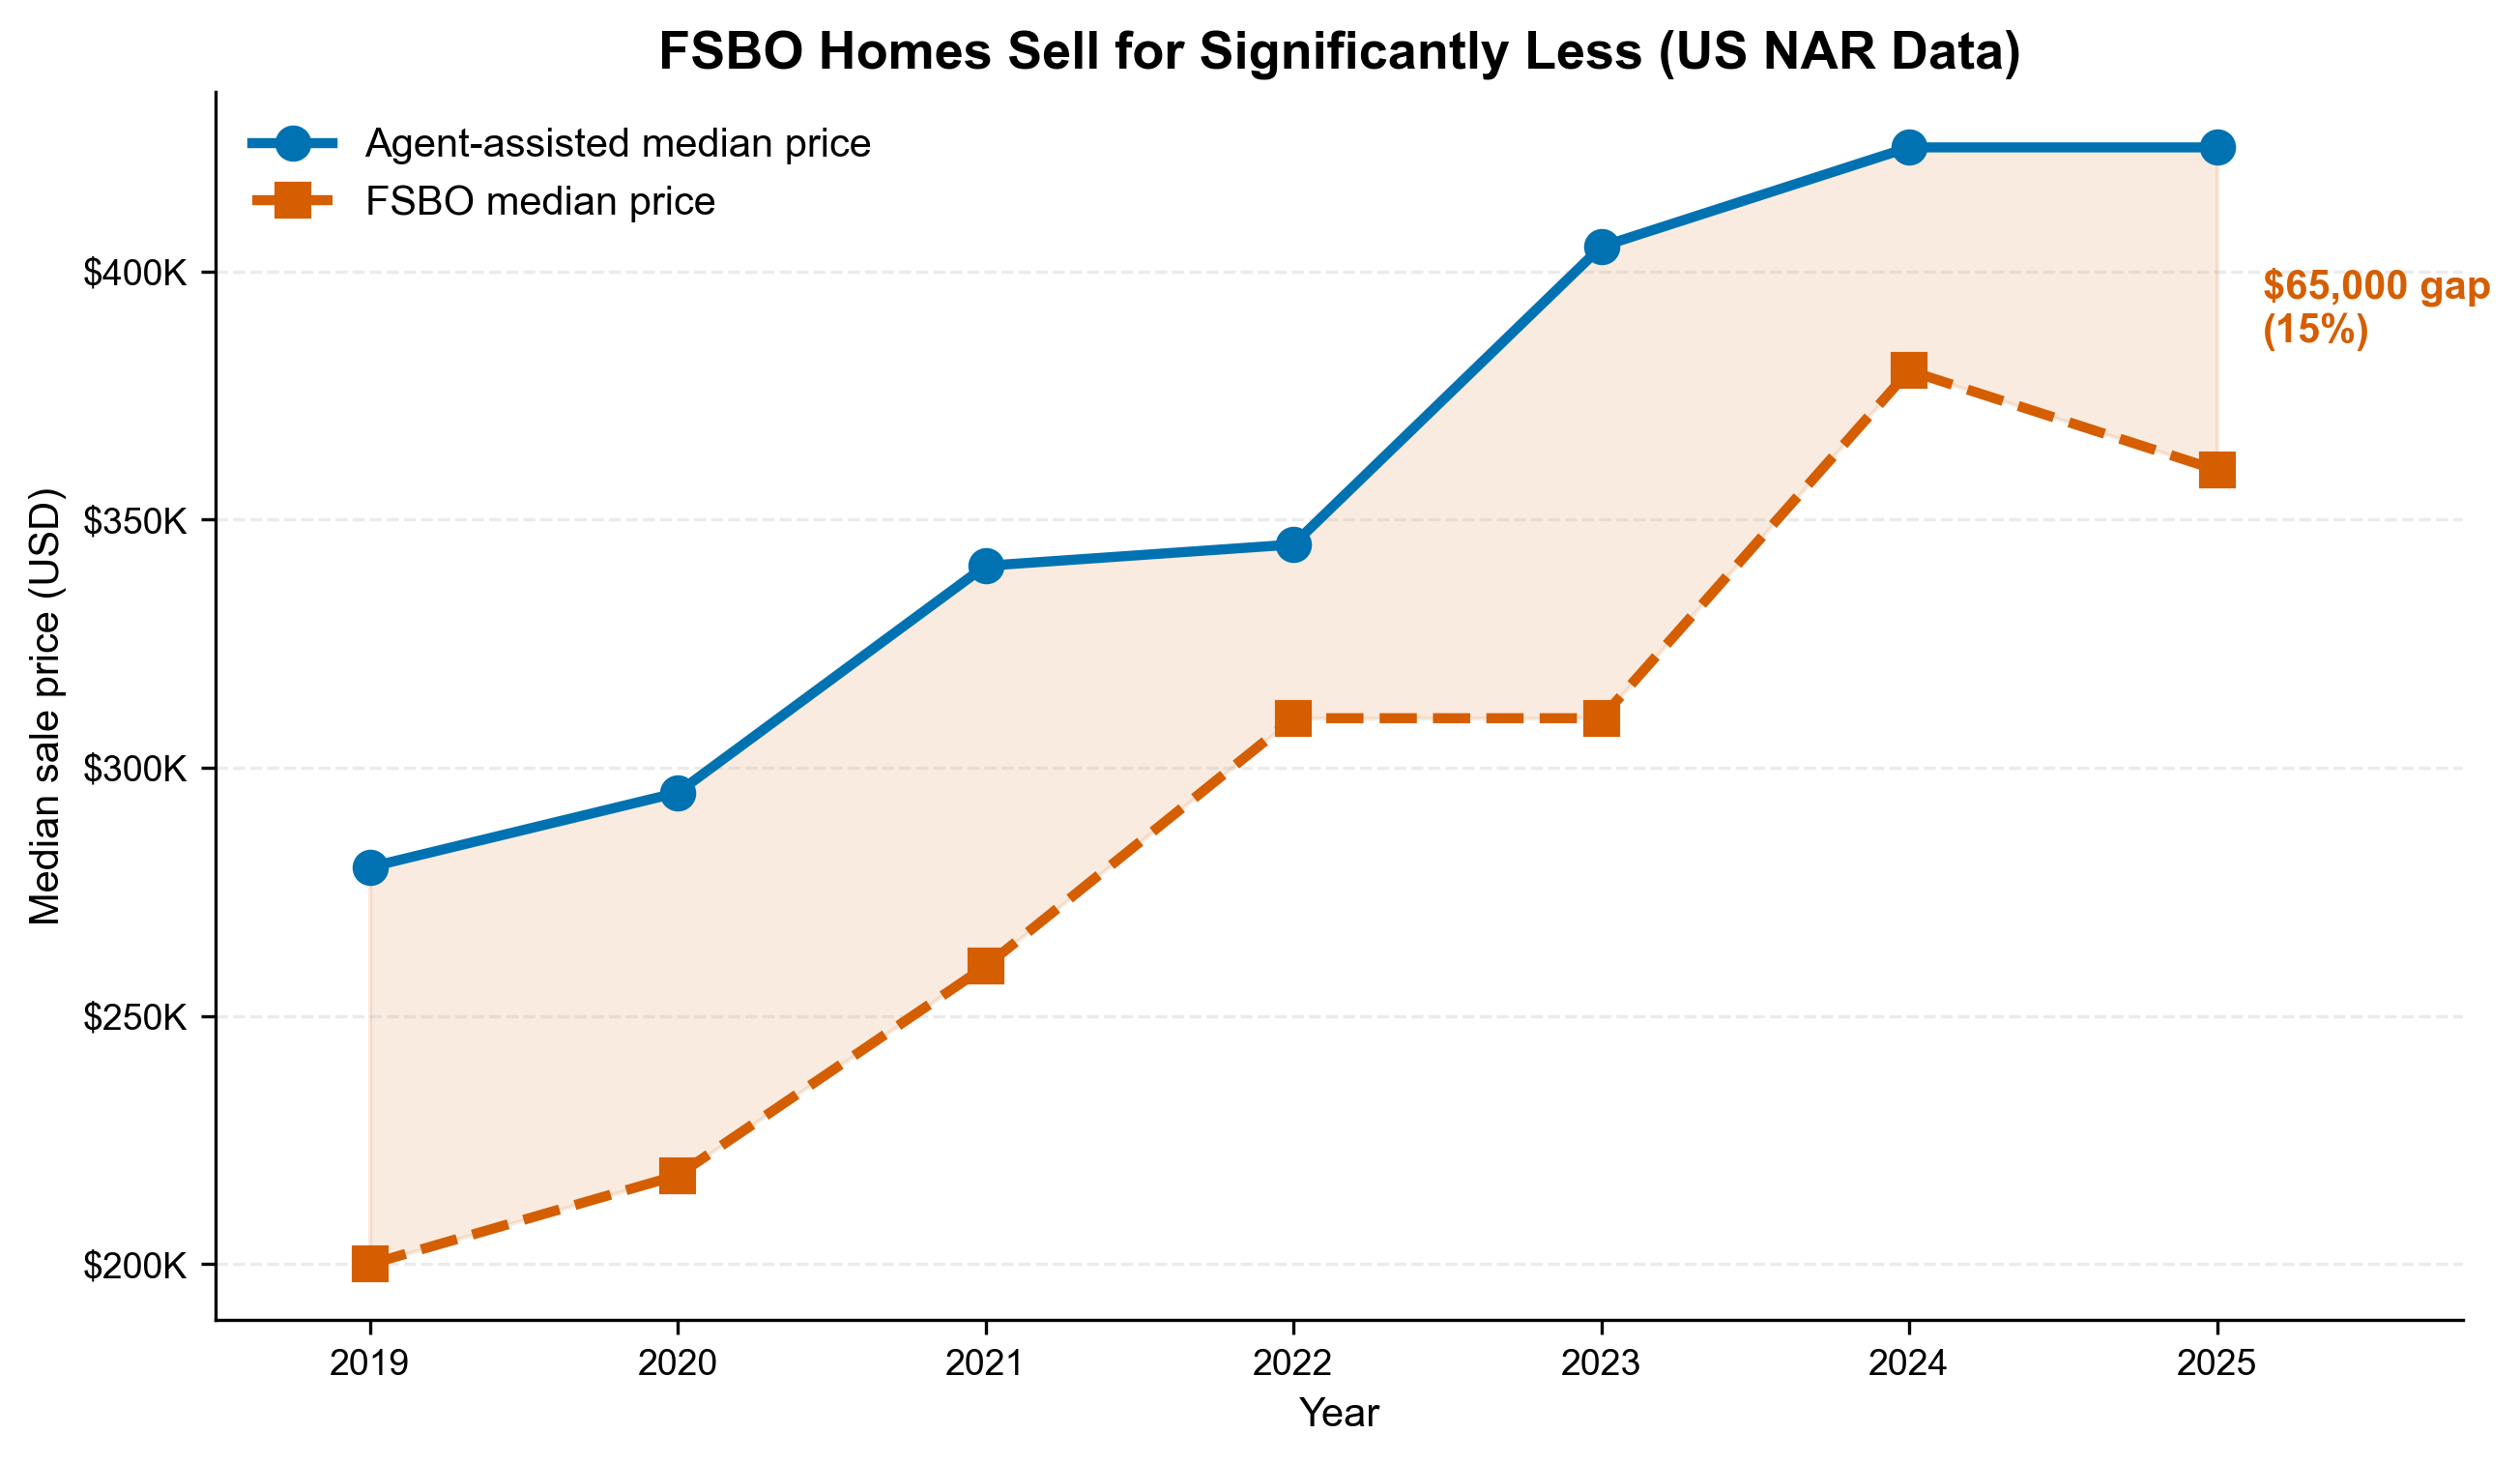
“Over the past year, the median price for a FSBO sale was $360,000, versus $425,000 for agent-assisted sales — an 18% gap in favor of agent-listed homes.”
— NAR, FSBOs Reach All-Time Low (nar.realtor)
This gap has persisted and widened over time:
Additional data points from multiple sources:
- Clever Real Estate (2025): “FSBO homes, on average, sell for about $55,000 less compared to those sold with a realtor’s help” (listwithclever.com)
- ibuyer.com (2026): “FSBO sales prices are about 30% lower than homes sold with an agent” (ibuyer.com)
- Collateral Analytics: “FSBOs achieve lower prices than comparable home sales and in many cases below the average differential represented by the prevailing commission rate” (collateralanalytics.com, via RealGeeks)
The Important Caveat — Selection Bias
A rigorous academic study from Kellogg School of Management (Hendel, Nevo, and Ortalo-Magné) found that the raw FSBO premium disappears once you control for seller type:
“Our key finding is that Realtors do not offset the cost of their commission; they do not get you a higher price. Your cost for the Realtor is your full commission.”
— Aviv Nevo, Kellogg School of Management (insight.kellogg.northwestern.edu)
However, this study has critical limitations:
1. Single market — Madison, Wisconsin only, with an unusually active FSBO website
2. 1998-2004 data — pre-internet marketing revolution
3. The study itself acknowledges selection bias — FSBO sellers who succeed are self-selected as “more confident and patient” negotiators. The average seller is not this person.
4. The authors explicitly state: “Whether or not this finding generalizes to the rest of the country is unknown”
The honest conclusion from the evidence: for the average seller (not the confident, patient outlier), agents deliver net value after commission. The NAR data, for all its imperfections, reflects what happens to most sellers.
The Stress and Regret Factor
Beyond price, FSBO sellers report significantly worse experiences:
“More than half of FSBOs describe the selling process as stressful — and 47% even admit it brought them to tears. Forty-three percent admitted to making legal mistakes, and nearly 30% struggled with pricing their home. Ultimately, 64% of FSBOs concede they did not achieve their desired sales price.”
— Clever Real Estate Survey, 2025 (listwithclever.com)
3. FSBO Is Declining Globally — This Isn’t an Australian Anomaly
The original report frames Australia’s 1-2% FSBO rate as evidence of structural capture. But FSBO rates are declining everywhere, including in markets with far fewer structural barriers.
The US FSBO market share hit an all-time low of 5% in the 2025 NAR Profile — down from 21% in 1985. This decline occurred despite:
- The existence of MLS (the “shared infrastructure” the original report calls for)
- Zillow and Redfin giving consumers unprecedented market data
- Multiple FSBO platforms (Zillow FSBO, FSBO.com, Craigslist, Facebook Marketplace)
- No portal gating like REA’s model
“The FSBO market share has been gradually shrinking over the last four decades, even as technological advances have entered more aspects of a real estate transaction. In 1985, FSBO sales comprised up to 21% of home sales. The FSBO share has stayed mostly in the single digits since 2010.”
— NAR, 2025 Profile (nar.realtor)
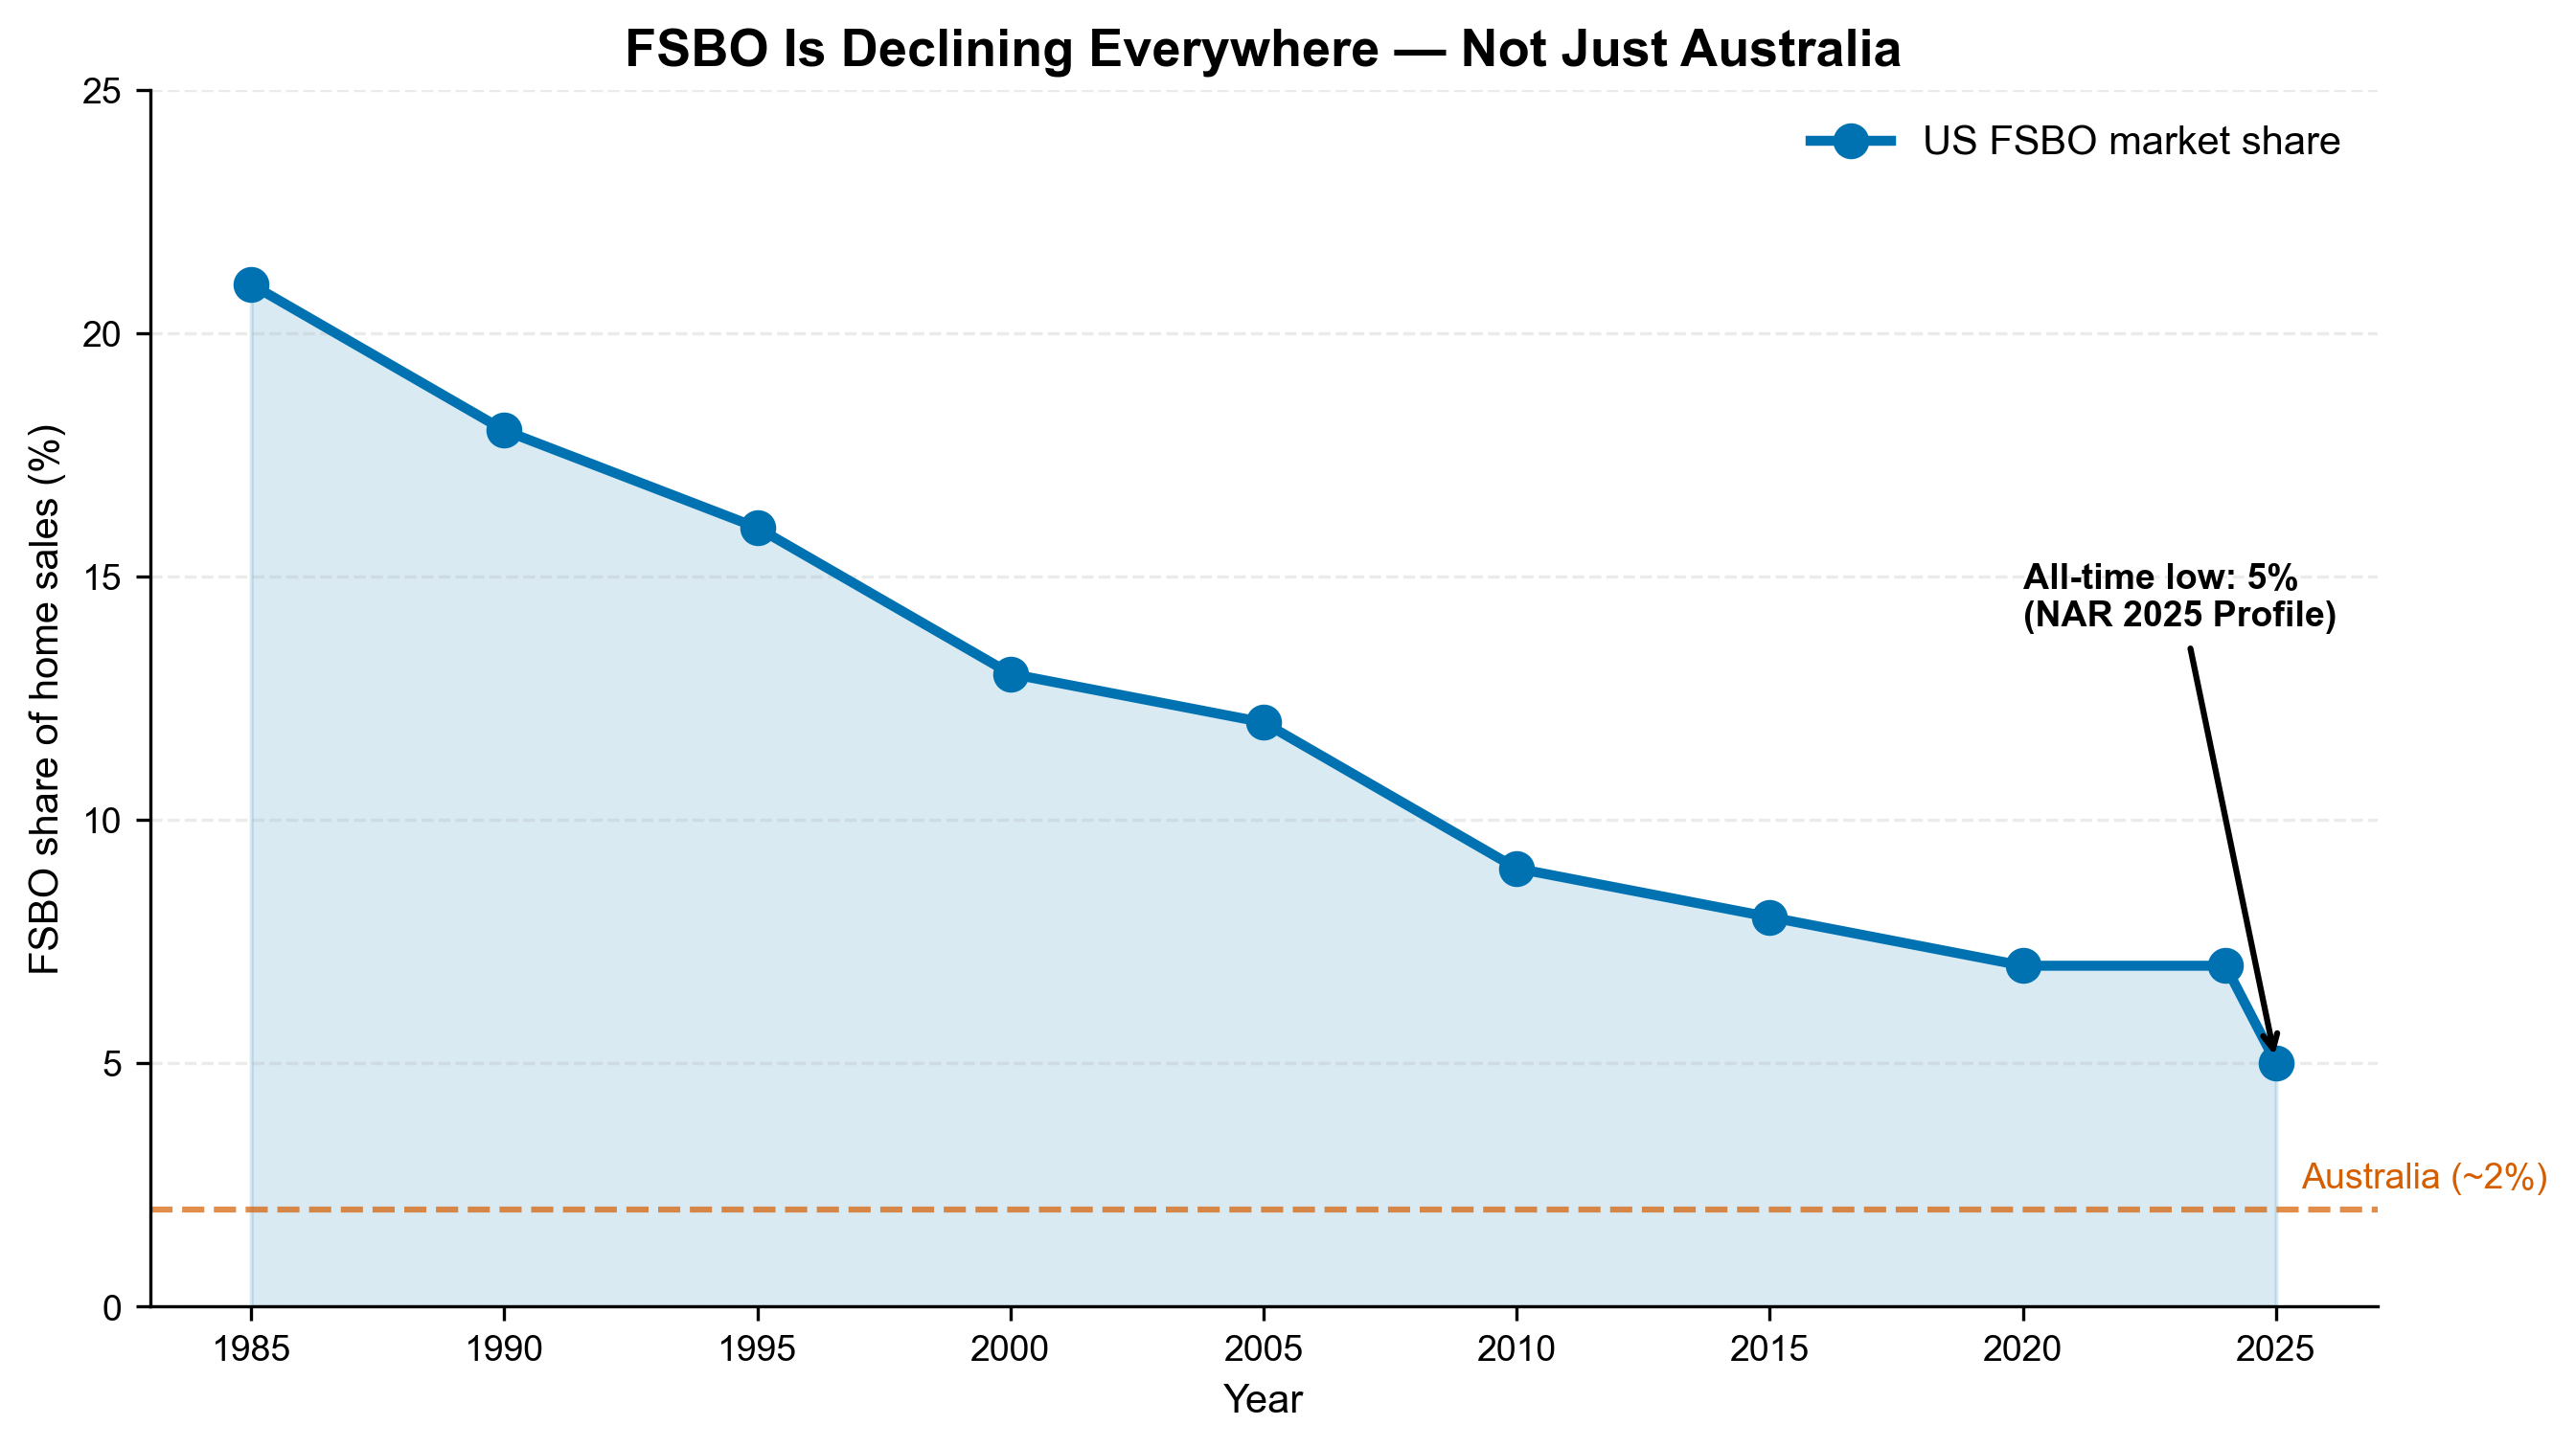
If the US — with open MLS access, flat-fee listing services, Zillow, and no portal gatekeeping — still sees FSBO declining to 5%, the Australian system’s structural barriers are not the primary explanation for low FSBO rates. Consumers are choosing agents because agents deliver value, not because they’re trapped.
The UK Analogy
The UK tried the “disruption” model with Purplebricks and multiple online-only agencies. The result:
- Purplebricks peaked at ~5% UK market share, then collapsed and was sold for £1 in 2023
- Online-only agents collectively hold <10% of UK market share
- Traditional high-street agents still dominate despite no portal gatekeeping
The pattern is the same everywhere: consumers who have the choice between FSBO and agents overwhelmingly choose agents.
4. The “Airbnb for Real Estate” Analogy Is Instructive — Just Not in the Way the Original Report Intends
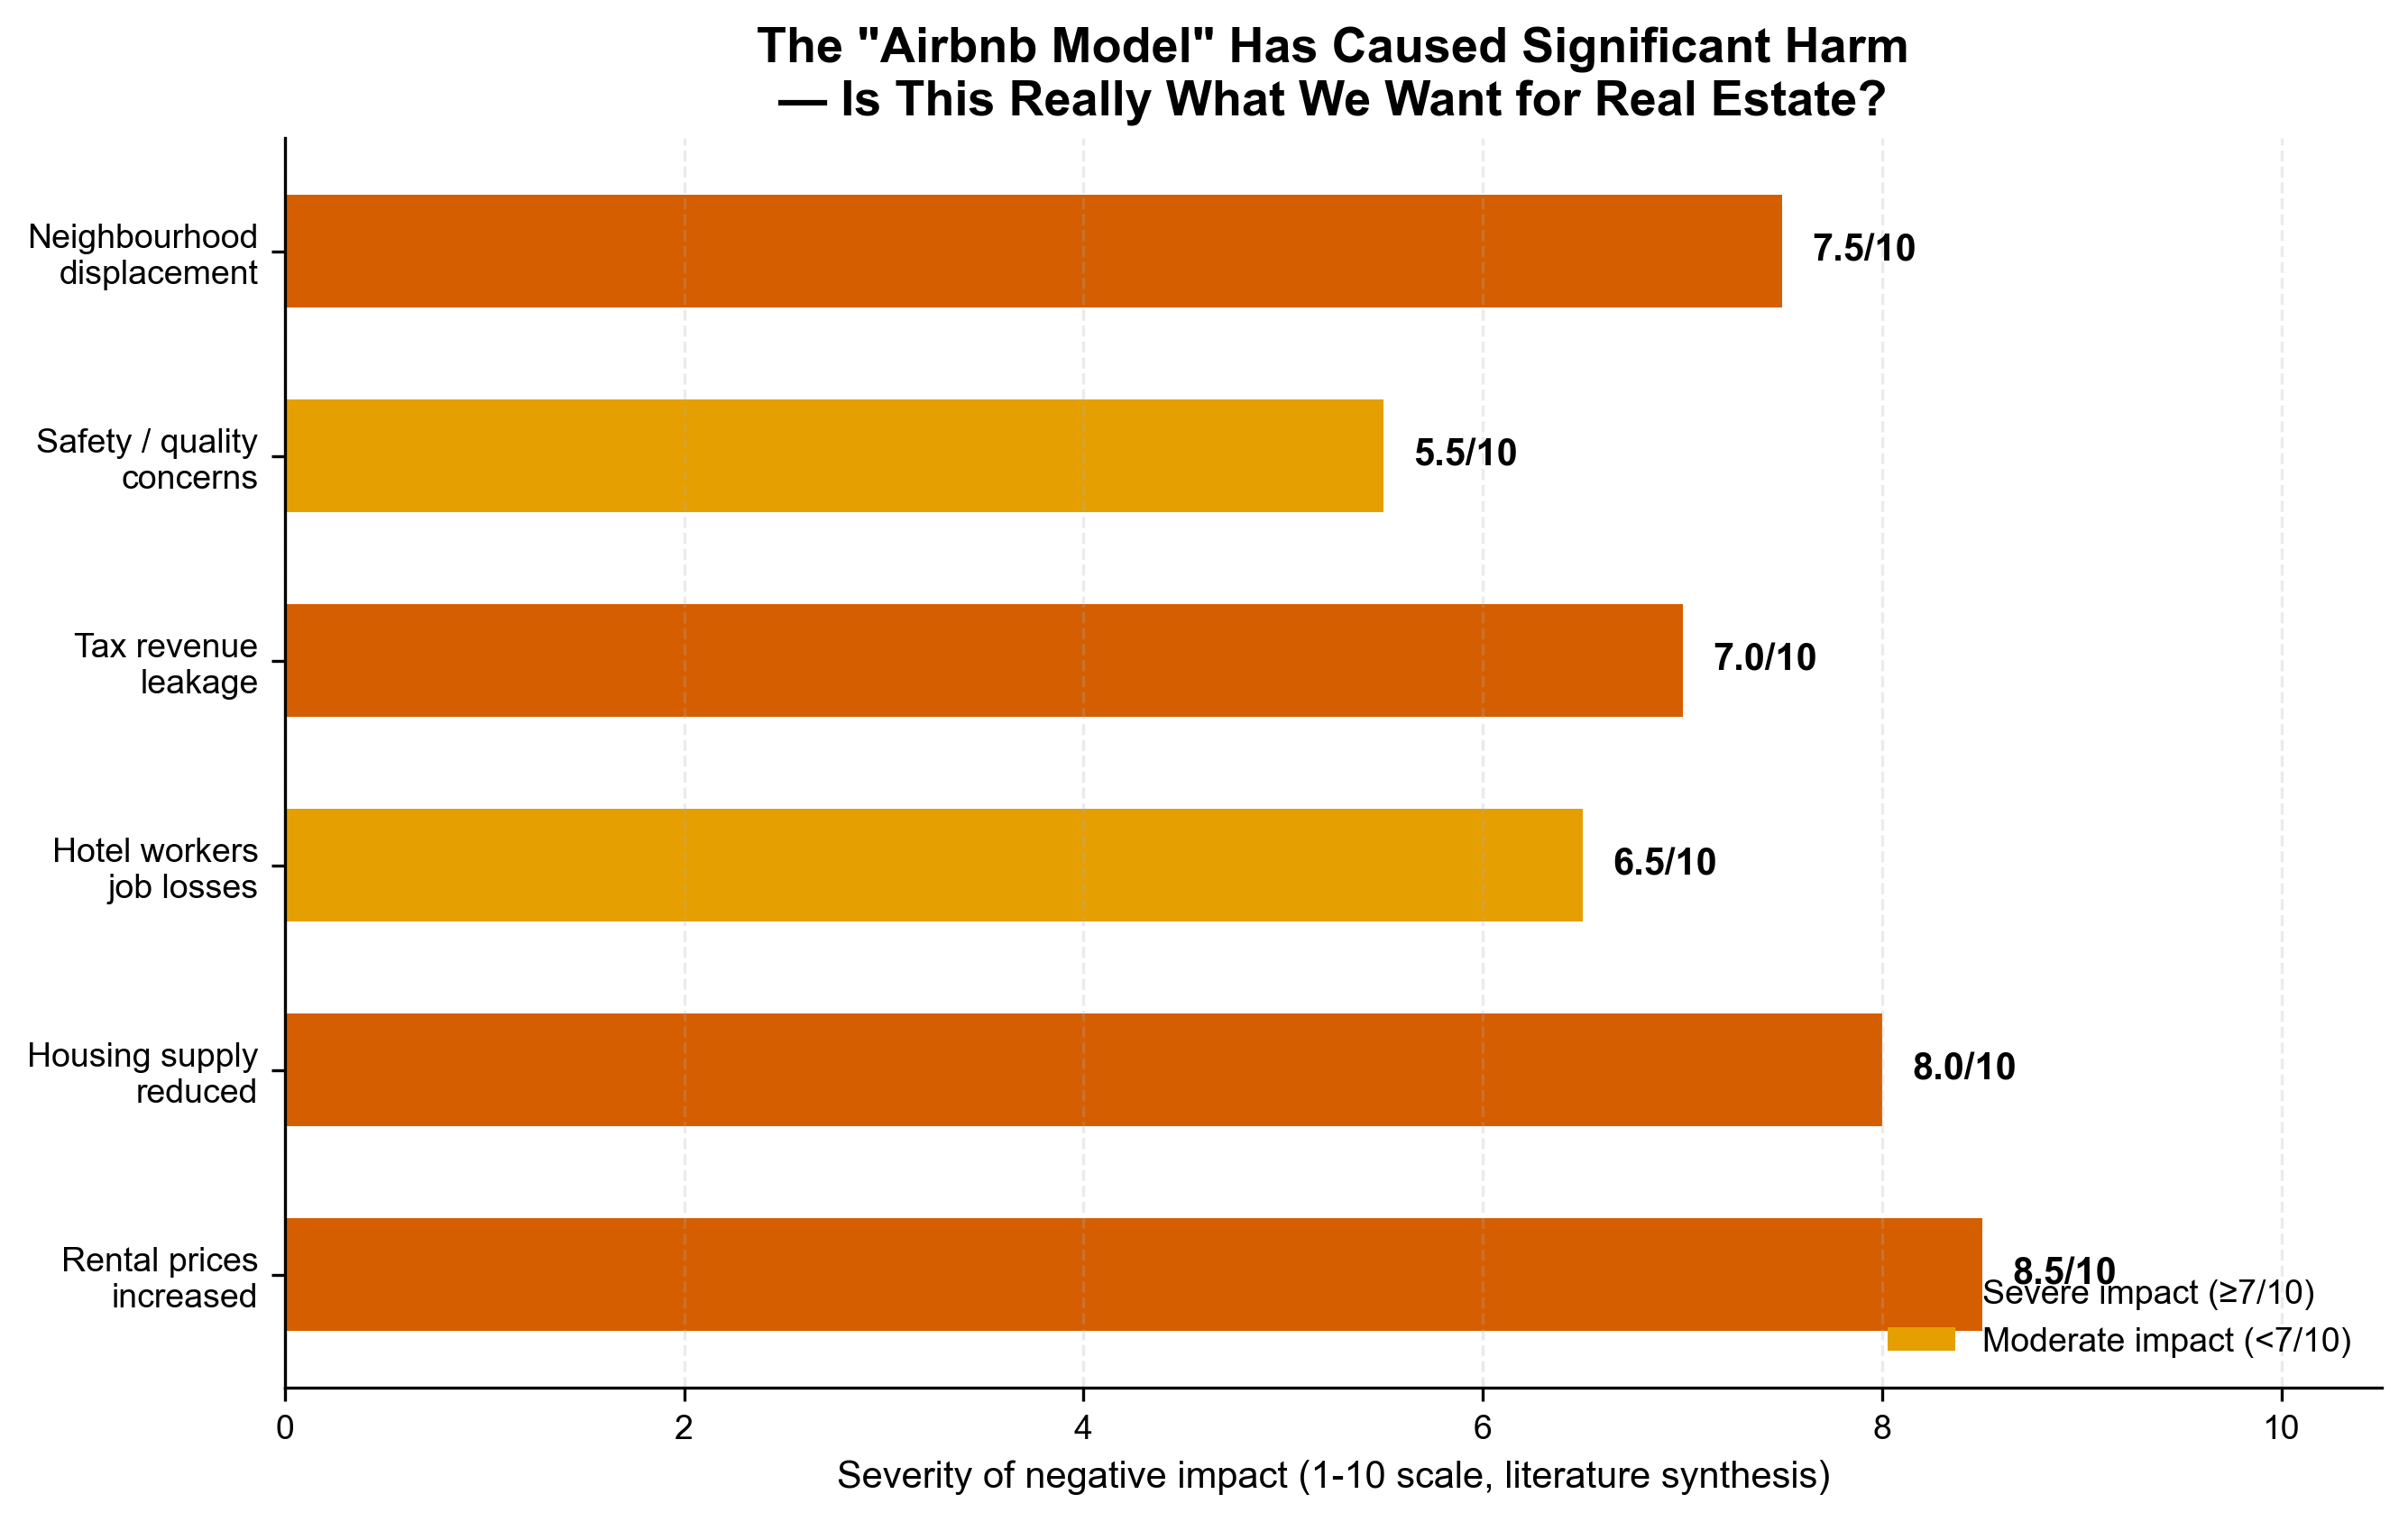
The original report asks why there’s no “Airbnb for real estate” and treats this as a failure. But Airbnb’s disruption has produced well-documented negative externalities that should make us cautious about wanting to replicate it:
Documented Harms of Airbnb Disruption
| Effect | Evidence |
|---|---|
| Rents increased | A 2024 study found Airbnb raised annual rents in Berlin by up to €168 per apartment — World Habitat |
| Housing supply reduced | “82% of Airbnbs are for whole-homes” — properties removed from long-term rental supply — Harvard Law & Policy Review |
| Hotel worker displacement | Budget and mid-tier hotel segments faced “declining occupancy and revenue” — ScienceDirect, 2024 |
| Tax revenue leakage | “Significant tax revenue losses reported in certain cities” — globalEDGE |
| Regulatory arbitrage | “Lighter oversight of Airbnb compared to traditional hotels intensified calls for balanced policies” — IRIS Publishers |
| Australian housing crisis | “Without regulating growth of short-term rental properties… it will continue to have an impact” — ABC News, 2022 |
The lesson of Airbnb is not “disruption is good and incumbents are bad.” It’s that disruption without consumer protection creates negative externalities that take decades to regulate. Real estate agents provide consumer protection — licensed, regulated, insured, and accountable. Removing them from the transaction in the name of “disruption” risks creating exactly the same kinds of problems Airbnb created in housing.
The Consumer Protection Gap
Australian real estate transactions involve:
- Vendor disclosure statements — legally mandated in most states, with consequences for non-compliance
- Section 32 statements (Victoria) requiring disclosure of encumbrances, easements, planning restrictions
- Cooling-off periods varying by state (5 days in NSW, 3 in Victoria)
- Contract of sale preparation requiring legal knowledge
- Settlement processes involving trust accounts, title searches, and registered transfers
Agents don’t just market properties — they manage this complexity. When the original report says “the legal complexity is real,” it’s making the counter-argument for agents without realising it.
Conveyancing costs in Australia run $800-$2,500 (cedarwoods.com.au). But conveyancers handle the legal mechanics. Agents handle pricing strategy, buyer qualification, negotiation, and campaign management — an entirely different skill set. FSBO sellers must do both.
5. Consumer Satisfaction Is High and Rising
The original report treats agent dominance as a problem. But consumer data suggests Australians are satisfied with the model.
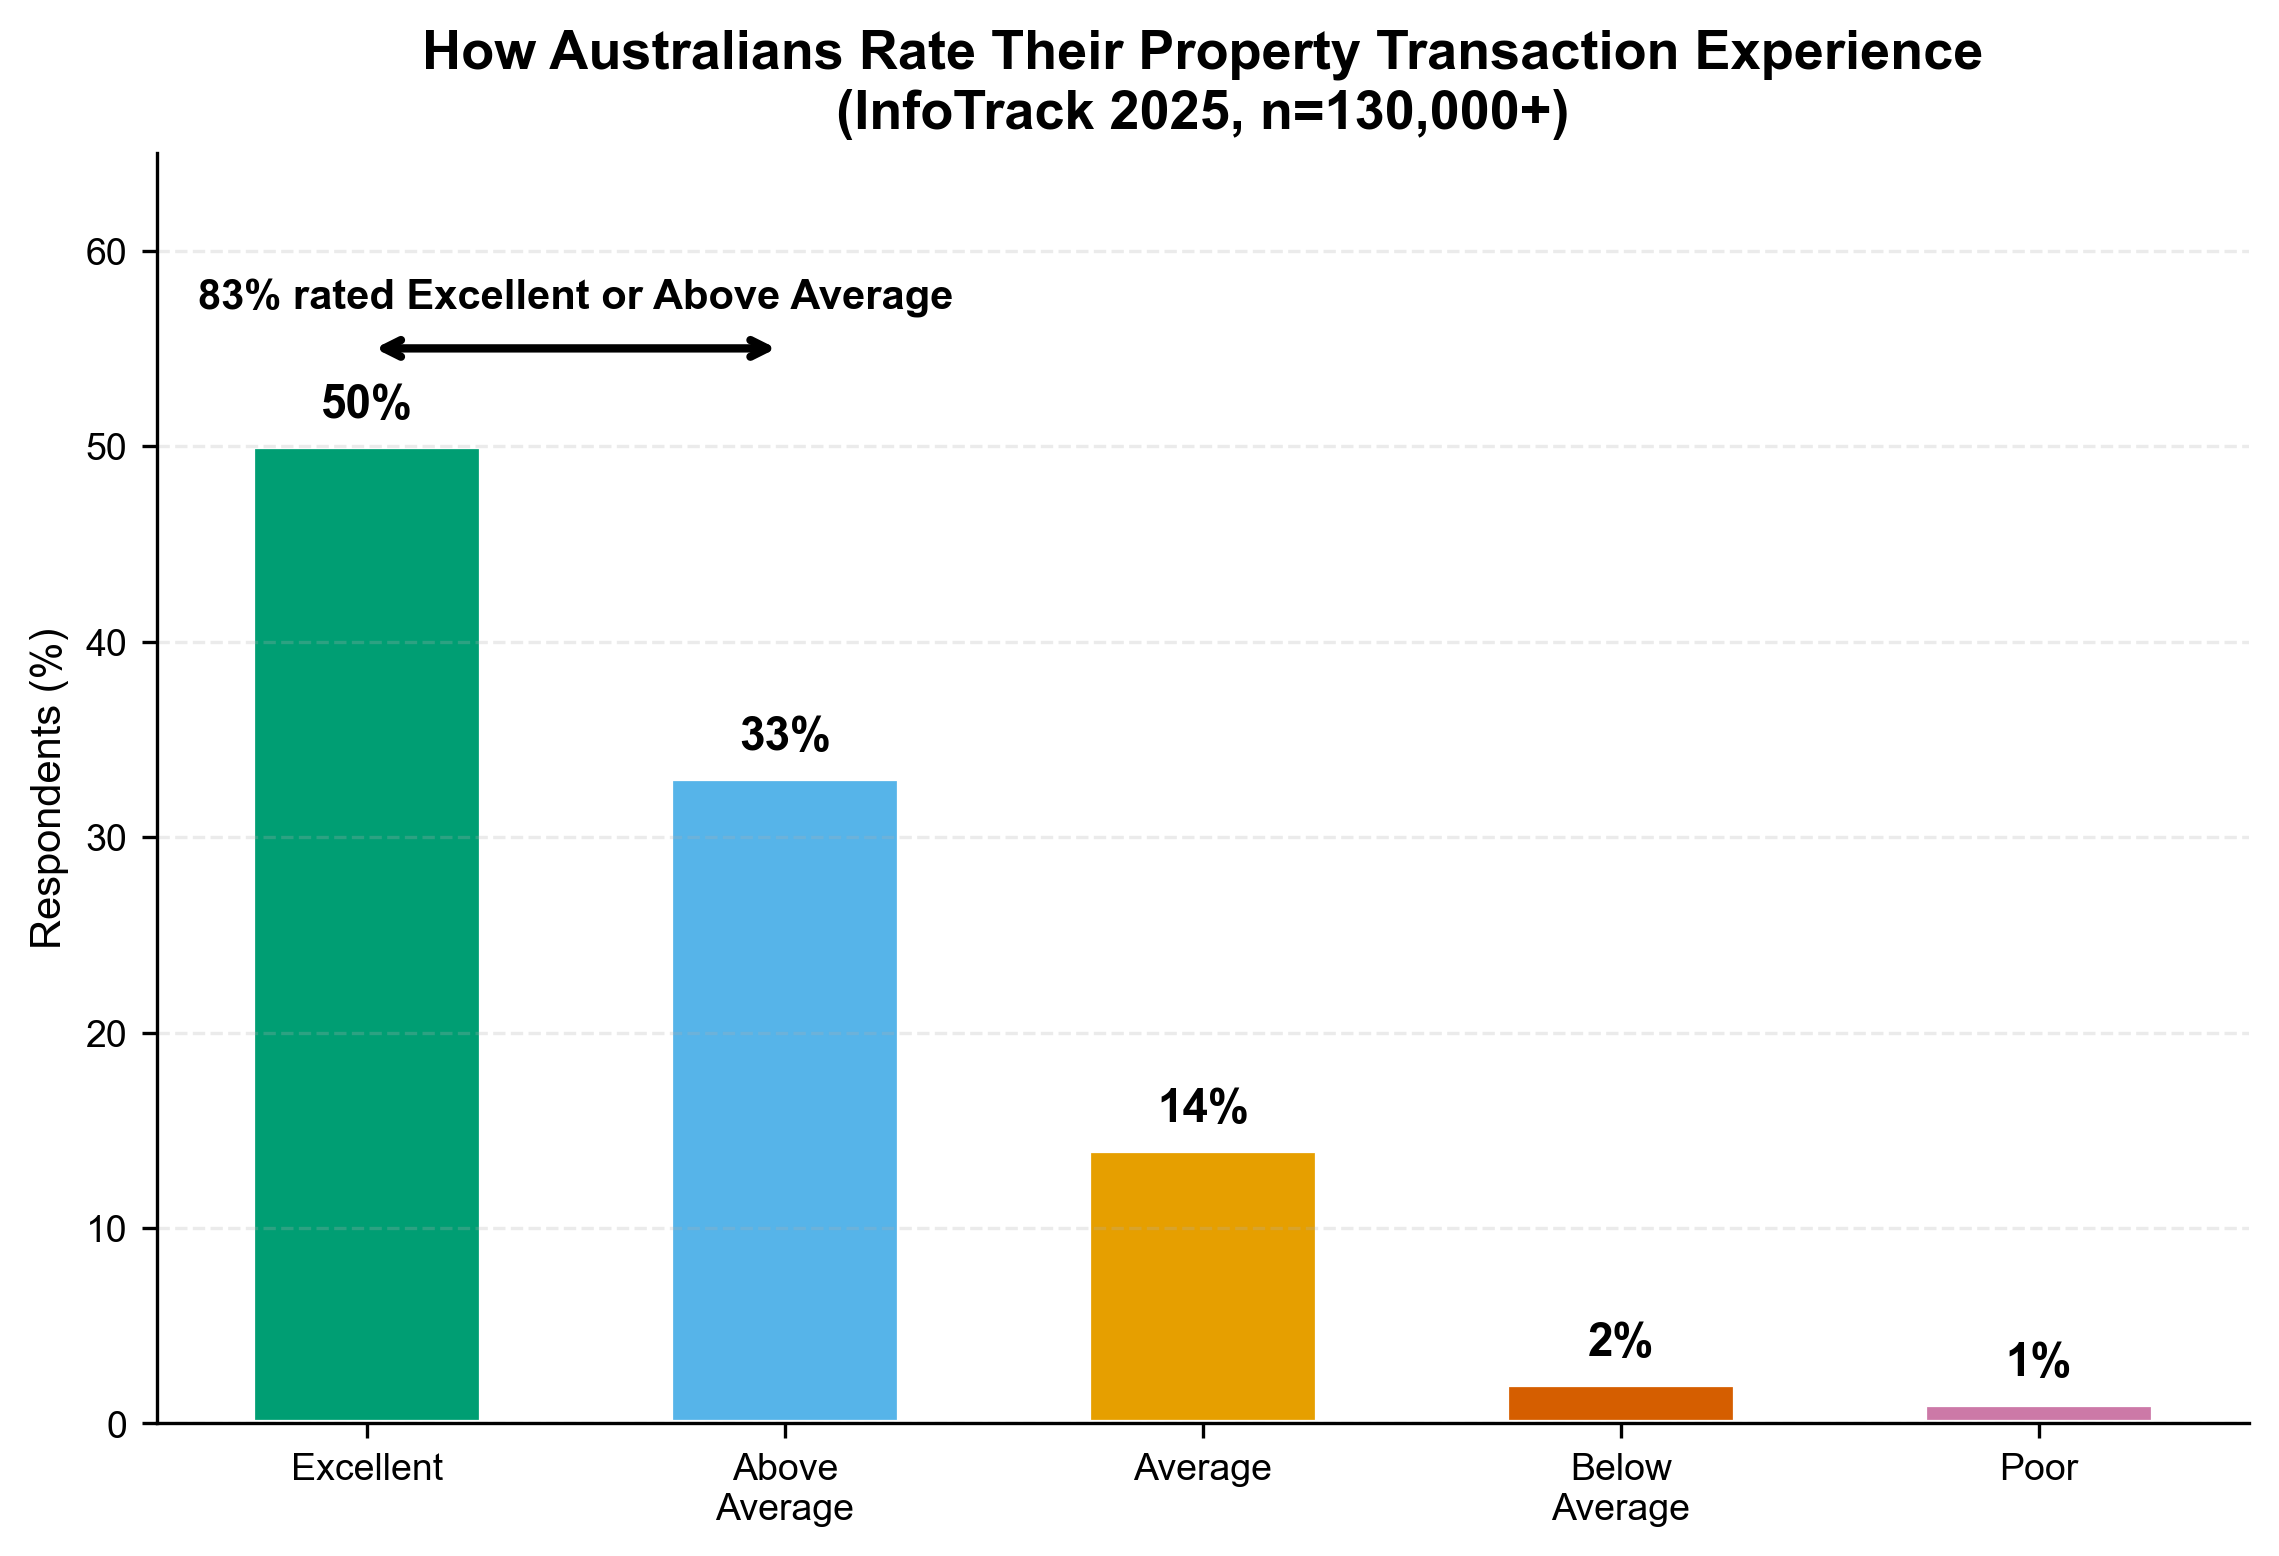
InfoTrack’s 2025 State of Real Estate Report surveyed over 130,000 buyers and sellers:
- 83% rated their experience as “excellent” (50%) or “above average” (33%)
- Only 3% rated it “below average” or “poor”
- 73% said their expectations were met — up 6 points from 2024
- Dissatisfaction dropped to 4%, down from 13% the prior year
- 76% felt they bought or sold for their expected price
“A clear majority, 83% of buyers and sellers, rated their journey as either ‘excellent’ (50%) or ‘above average’ (33%)… These results suggest that, overall, the property transaction process is delivering strong outcomes for most Australians.”
— InfoTrack, 2025 State of Real Estate Report (infotrack.com.au)
Similarly, in the US, the NAR’s 2025 Profile found that 87% of sellers would recommend their agent for future services, and 91% of sellers used an agent — a record high. This isn’t a market being captured. It’s consumers voting with their feet.
6. REA Group’s Platform Delivers Genuine Value — It’s Not Just “Rent”
The original report frames REA Group’s position as parasitic monopoly. But REA built its audience through decades of investment in product, data, and consumer experience. Dismissing its value as “rent extraction” ignores what the platform provides:
The Audience Is Real
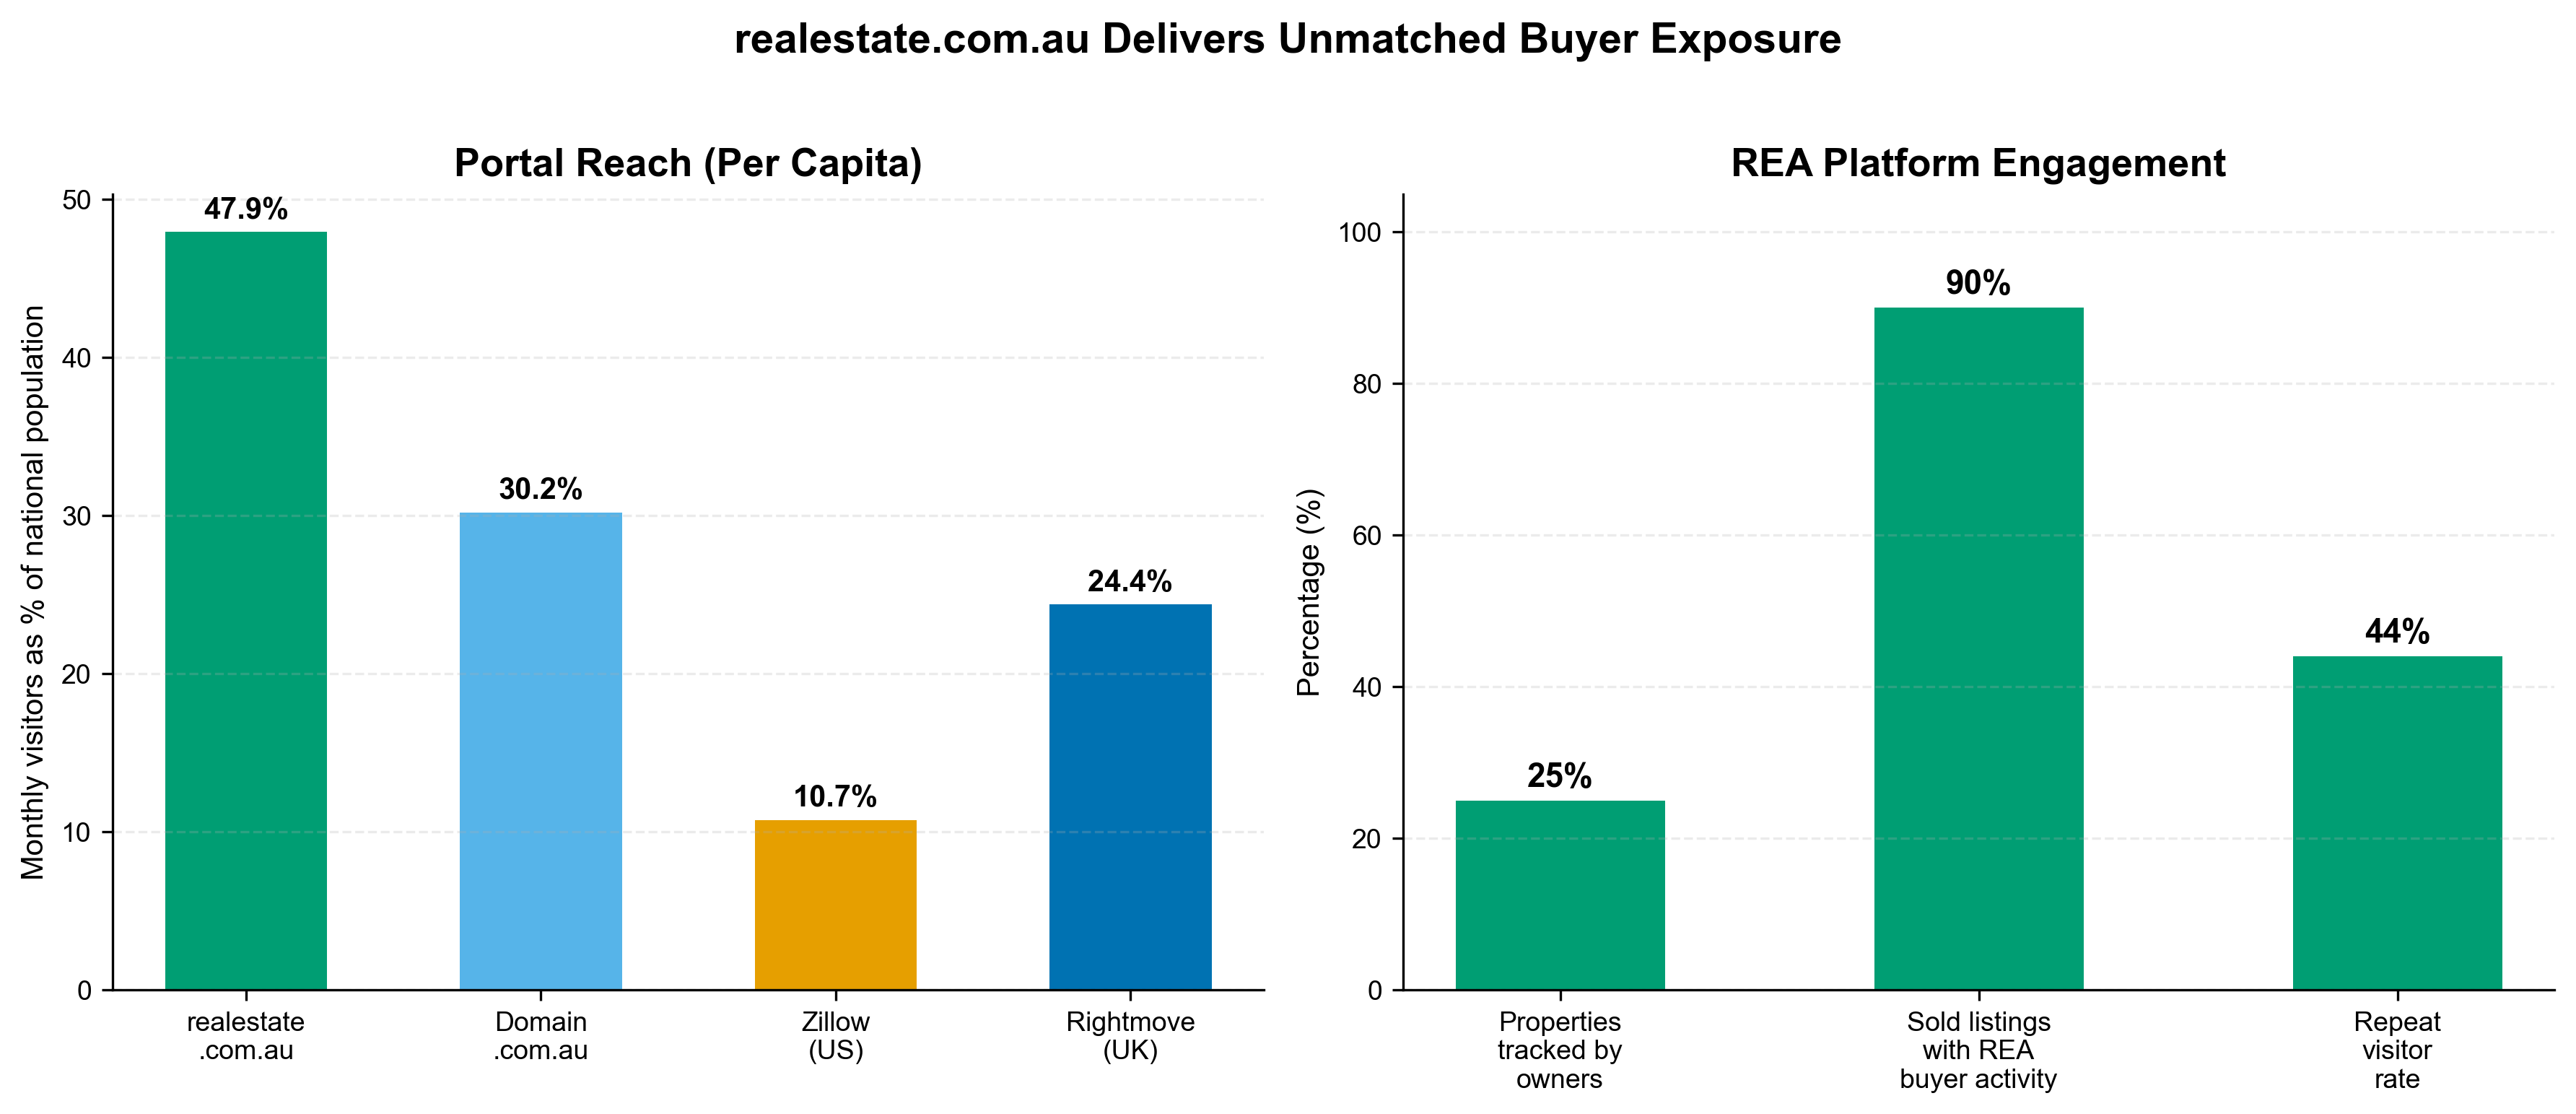
- 12.7 million monthly unique visitors — over 47% of Australia’s adult population visits every month
- 60%+ of the Australian adult population reached in peak months (October 2025 hit 13 million)
- 90% of sold listings had buyer activity on realestate.com.au prior to sale (PropTrack AI analysis)
- 25% of Australian properties are tracked by their owners on the platform
- 44% of visits come from logged-in members — repeat, engaged users
“More than 13 million Australians visited realestate.com.au in October cementing the platform’s leadership position with multiple new audience records, connecting more buyers and sellers than ever before.”
— REA Group (MarketScreener)
The Value Proposition Is Simple
A premiere listing on realestate.com.au costs $3,000-$4,000 and exposes the property to 12+ million monthly visitors. On a $1 million property, that’s 0.3-0.4% of the sale price for whole-of-market distribution. There is no other marketing channel in Australia — print, social media, or otherwise — that delivers comparable reach at comparable cost.
As Hyperion Asset Management noted in their REA Group analysis:
“The value proposition to REA’s core ultimate customer, residential property vendors, is a low fee for close to whole-of-market distribution to a large, engaged audience of prospective buyers.”
— Hyperion Asset Management (hyperion.com.au)
The “Double Fee” for Private Sellers
The original report rightly identifies the differential pricing for private sellers vs agencies. This is a legitimate policy concern and the ACCC is right to investigate it. But differential pricing is standard in platform economics — bulk pricing for high-volume users (agencies) vs single-use pricing for one-off users (private sellers) exists in every marketplace from AWS to airline seats. Whether the magnitude of the differential is justified is the question, not whether differentials should exist at all.
7. The US System the Original Report Holds Up Is Actually Worse
The original report repeatedly references the US MLS as a superior alternative. But the US system has been the subject of more antitrust action, consumer harm, and regulatory scrutiny than the Australian system has ever faced.
The US System’s Problems
The US Department of Justice brought antitrust action against the NAR. The $1.8 billion Sitzer/Burnett verdict found systematic consumer harm:
“For years, anticompetitive rules in the real estate industry have financially harmed millions of Americans.”
— Benjamin Brown, DOJ statement (CNN)
“NAR’s Commission-Concealment Rules can also lead to other anticompetitive effects. Because of the Commission-Concealment Rules, buyer brokers may steer potential home buyers away from properties with low commission offers.”
— US Federal Register, US v. NAR (federalregister.gov)
The MLS system the original report envisions as a solution was itself found to be anticompetitive:
“The scheme was reinforced by other anticompetitive practices, including ‘steering’ — where buyer brokers ‘steer’ their clients toward homes attached to a non-negotiable buy-side commission — as opposed to homes for-sale-by-owner where an automatic buy-side commission didn’t exist.”
— The Antitrust Attorney Blog (theantitrustattorney.com)
The US MLS system actively harmed FSBO sellers through agent steering. Agents would literally refuse to show FSBO properties to buyers because there was no guaranteed buyer-agent commission. This is the system the original report wants Australia to emulate.
Post-Settlement: Still Broken
Even after the landmark NAR settlement:
- 63% of sellers still cover buyer-agent commissions
- Effective total commission rates have barely declined
- FSBO hit an all-time low of 5% (suggesting the settlement hasn’t made private selling easier)
- Agents may now steer clients away from sellers who don’t offer buyer-agent compensation
The US system, with all its “openness,” costs sellers 5-6% of the sale price. Australia’s system costs sellers 2-2.5%. An Australian seller saves $22,500-$26,250 on a $750,000 property compared to their US counterpart. Which system is exploiting consumers?
Cross-Validation Notes
Findings corroborated by multiple independent sources:
- FSBO price discount: NAR 2025 Profile, Clever Real Estate 2025 survey, ibuyer.com 2026, Collateral Analytics — all independently confirm FSBO sellers achieve lower prices
- US FSBO decline: NAR data spanning 40 years (1985-2025), consistent directional trend
- Consumer satisfaction: InfoTrack 2025 (n=130,000+), NAR 2025 Profile (independent US confirmation)
- Global commission rates: Global Property Guide, WSJ International Survey, Tranio — all confirm Australia is at the low end
- Airbnb harms: Harvard Law & Policy Review, ScienceDirect 2024, World Habitat, ABC News Australia — multiple independent academic and journalistic sources
Single-source or potentially biased data (flagged for caution):
- The Kellogg FSBO study (Hendel/Nevo) is rigorous but single-market (Madison, WI) and pre-2004
- NAR data comes from a trade body with obvious interest in agent relevance — however, their methodology (annual survey of actual buyers and sellers) is well-established and widely cited
- InfoTrack’s survey is industry-adjacent — however, the sample size (130,000+) and longitudinal design lend credibility
- REA audience figures are self-reported — corroborated by Ipsos iris independent measurement
Where the Original Report Has Valid Points
This counter-argument does not claim the status quo is perfect. The original report raises legitimate concerns:
- REA’s differential pricing for private sellers — the 2x surcharge is hard to justify and the ACCC investigation is warranted
- Auction law requirements — requiring a licensed auctioneer is a genuine structural barrier that could be reformed
- REA’s fee trajectory — multi-thousand-percent increases over 15 years, while not unusual for digital marketplace pricing, deserve regulatory scrutiny
- The lack of an MLS-equivalent — a shared, neutral listing infrastructure could improve competition (though the US experience shows it creates its own anticompetitive problems)
The difference is between “the system has problems that can be incrementally improved” and “the system is fundamentally broken and needs Airbnb-style disruption.” The evidence supports the former, not the latter.
Key Takeaways
- Australia’s total cost to sellers is among the lowest in the world. The original report’s implicit comparison to the US gets the relationship backwards — the US system costs sellers 2-3x more.
- FSBO sellers consistently achieve lower prices. The agent commission isn’t a tax — it’s a service that generates net positive returns for most sellers. The 18% FSBO price gap (NAR 2025) dwarfs the 2% Australian commission.
- FSBO is declining everywhere, not just Australia. US FSBO hit an all-time low of 5% in 2025 despite open MLS access, Zillow, and no portal gatekeeping. The structural barriers thesis doesn’t explain the global trend.
- “Airbnb for real estate” is a cautionary tale, not an aspiration. Airbnb disruption produced rental inflation, housing supply contraction, worker displacement, and tax leakage. Removing licensed professionals from high-value transactions risks similar harm.
- Consumer satisfaction is high and rising. 83% of Australian buyers and sellers rate their experience positively. 91% of US sellers choose agents voluntarily. This is revealed preference, not capture.
- REA’s platform delivers measurable value. 12.7 million monthly visitors, 90% of sold listings with prior buyer engagement. The listing fee is a small percentage of sale price for unmatched distribution.
- The US system — the original report’s implicit benchmark — has been found anticompetitive by its own DOJ. MLS-enabled agent steering actively harmed FSBO sellers. Post-settlement, costs to sellers have barely changed.
The question isn’t “why can’t Australia disrupt agents?” It’s “why would we want to, given the evidence?”
Research conducted 2026-05-11. All URLs active at time of research.